Braddon work adds a new dimension to sustainable cities
Technology that allows us to plan our cities to be more sustainable in their critical infrastructure, use of materials, and their minimisation of waste and emissions, has been proven through CSIRO-led research applied to Braddon in the ACT.
Scientists from Australia’s national science agency CSIRO and international collaborators have harnessed available data and technologies to create a four-dimensional model of Braddon that effectively tracks the suburb’s buildings, embodied materials, waste and emissions across 60 years of its history. The findings of CSIRO’s application of this model of ‘urban metabolism’ were published in the Journal of Cleaner Production.
“The four-dimensional geographic information system (4D-GIS) model gave some great insights into changes in the development and material use at Braddon, and Braddon proved to be an ideal location to test the concept,” according to CSIRO’s research leader, Dr Heinz Schandl.
Following a decade of dramatic urban renewal, Braddon was Canberra’s most densely populated suburb at the time of study. It featured a mix of iconic buildings, commercial and light-industrial buildings single-family homes and multi-storey apartments.
How was the 4D-GIS model applied?
“Time is the fourth dimension and as part of this work we applied 4D-GIS to analyse the urban development of Braddon in three historical time steps – 1955, 1981 and 2015. We tracked the impact of urban planning decisions on material use and greenhouse gas embodiment,” Heinz says.
The 4D-GIS approach involves:
- generating a three-dimensional representation of the built environment using remotely sensed (satellite) data;
- classifying building types based on algorithms that draw upon location and shape information;
- using aerial photography to track changes in buildings and the urban environment over time;
- using building type, geometry, and construction period to inform the make-up of embodied materials and
- calculating the carbon footprint of building materials over the lifecycle of construction and demolition.

Model workflow for the generation of a 4D-GIS analysis of embodied materials and emissions in an urban built environment
Great implications for future city planning
“We found that around 282 thousand tonnes of carbon dioxide equivalent (CO2-eq) gases are embodied in the residential and mixed-use buildings in Braddon,” Heinz says . “That’s about the same amount of annual carbon sequestration and storage in 140 to 560 thousand hectares of Australian forests.”
“We know that around 10 per cent of the embodied CO2-eq in buildings is released during demolition and transportation, processing and disposal of construction waste. So with large scale demolition or refurbishment of pre-1982 buildings in Braddon, we could see around nine thousand tonnes of CO2-eq emissions released at a significant environmental and social cost.
“That’s just for Braddon. The implications are greater when you look at the city scale, particularly for larger cities with ageing infrastructure, rezoning, and constant turnover of buildings and infrastructure.”
The Braddon study has proven the model at the scale of a single suburb, but also shown the potential for the approach to be more broadly applied for sustainable development in Canberra and beyond, says Heinz.
“Having sound information for embodied GHG emissions is important at a time where we are striving for net zero emissions and carbon neutrality to limit climate change impacts,” he says.
“Reliable information about the environmental consequences of city planning, infrastructure and building decisions is vital not only to decision makers, designers and planners but to those who live in the houses or use the building and transport infrastructure.”

CSIRO scientists Raymundo Marcos Martinez, Heinz Schandl and Sorada Tapsuwan in Braddon. Photo: Elesa Kurtz, The Canberra Times/ACM
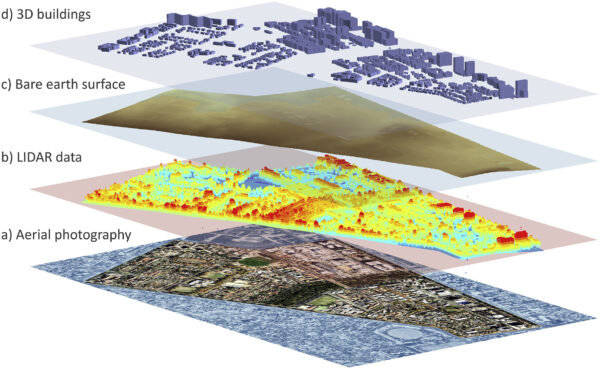
Figure showing 3D building data extraction. a) Reference high-resolution aerial photography. b) LIDAR data. c) Bare earth surface. d) 3D building polygons